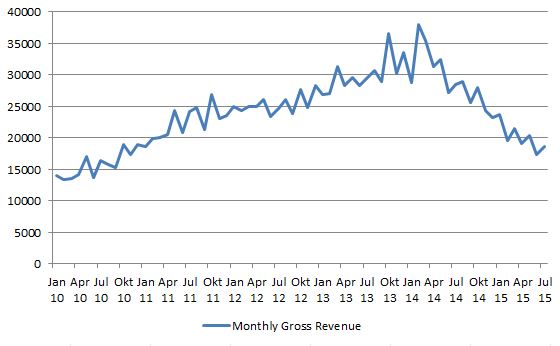
One could say that the above graph shows all there is to say about the current state of Gambling in Macau, yet we will come to that as we are deep diving into the current situation. First of all, the month of August has ended and figures for August will be released sometime later in September by DICJ. Until then we can work with what we see above. And what do we see?
- The peak gaming revenue was in February 2014
- The first sign of a low was in June 2014
- The downwards trend has continued (with smaller peaks in between) until July 2015
- Lowest point in the downward trend had been June 2014 so far with 17 billion MOP revenue, the same as experienced in November 2010 for the last time.
- July 2015, the last month on record logged 18.6 billion MOP, the same as experienced in January 2011 for the last time.
- Comparing the low in June 2015 with the peak in February 2014, Macau revenue has dropped by 55% in less than a year.
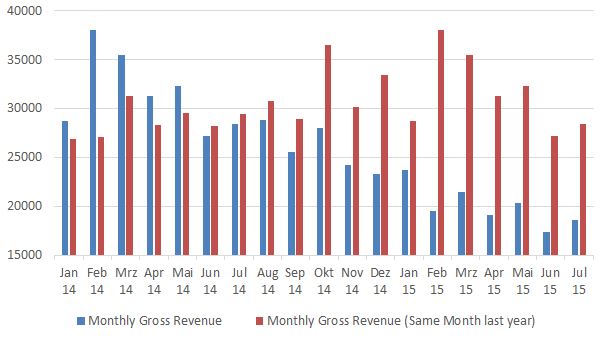
The following graphs capture the same set of data in slightly different views:
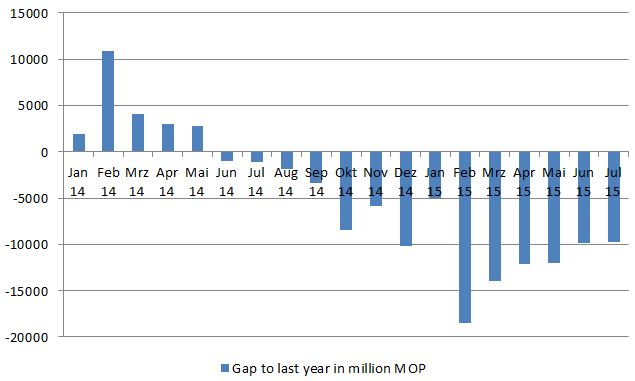
The above graph compares total revenue figures (in million MOP) month to previous years’ month. Also here the sudden drop in June 2014 is visible and there had been no month that was able to peak higher than the corresponding season the year before. That includes every month in 2015. That gap was highest in February 2015 as visualized below:
Whereas one might think that a stabilized graph, as seen between March to July 2015 is a good thing, in reality it is a sign of negative growth as it represents the gap towards the last years revenue figure and if continuing over a year resembles a downward trend.
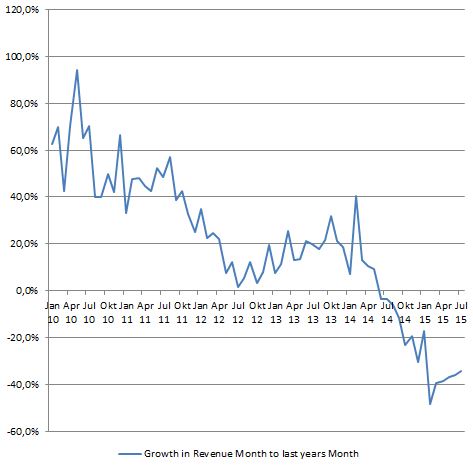
The above graph, with data from January 2010 all the way to July 2015 shows the growth rate of revenues compared on a month-to-last-years month basis in percentage. Once again, the downward trend is more than visible.
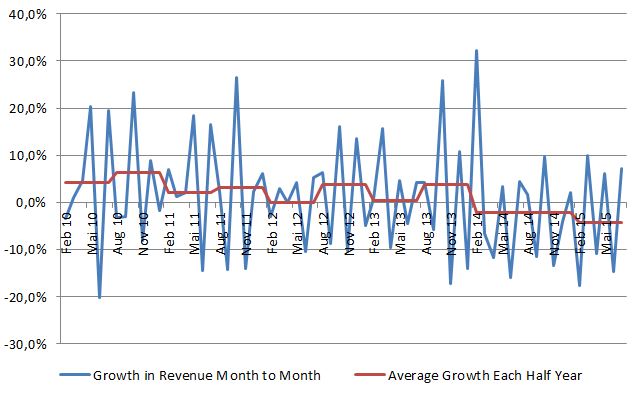
This graph is focussed on comparing growth rates between consecutive months, i.e. January 2015 to December 2014 and gives an indication on the general trend. The more peaks are below the 0% line, the more of a downward trend it is, whereas when there are more peaks above the 0% line, revenues are growing. The red line resembles the average for each half year of each month’s growth/decline percentage. Once again, the downward trend starting in 2014 is visible.
Whereas the above are great representations of probably the most talked about issue in Macau, they are all based upon one single set of data:
- Revenue of Games of Fortune in Macau
The above alone cannot be representable for the state of Macau is the following is not taken into account:
- Visitor figures
- Openings of hotels and casinos
- Unemployment figures
- External factors
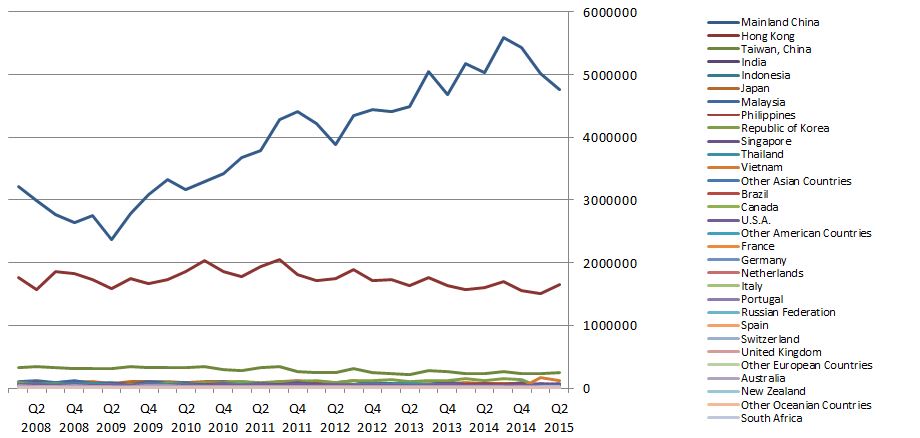
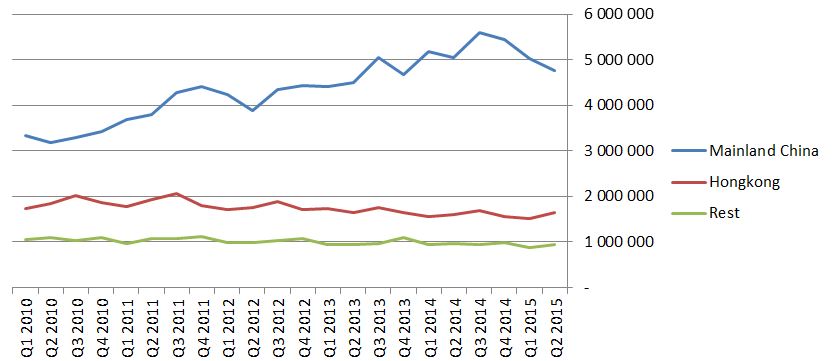
Let’s have a look at the visitor figures as published for Macau. DSEC has released figures up to Q2 2015 (and the month of July, which is being excluded in our comparison below).
Immediatelly visible is a drop in visitors from mainland China. This is also visible when one makes the overall graph for comprehensible:
Before going into further discussions on any of the implications, let’s review this a little bit further.
- Peak visitors overall to Macau had been in Q3 2014 (surprisingly in the quarter in which the drop of revenues occurred). The same quarter had also seen the highest amount of visitors from mainland China.
- Q2 of 2015 is the lowest quarter in the recent downward trend and is the lowest quarter since Q2 of 2013 (i.e. two years)
- The peak in visitors had actually not just been one quarter, but two quarters, with Q4 of 2014 having had the second highest number of mainland Chinese tourists (and the second highest overall visitor figure as well)
- Rest of World is pretty stable and Hongkong has not escaped it longterm downward trend.
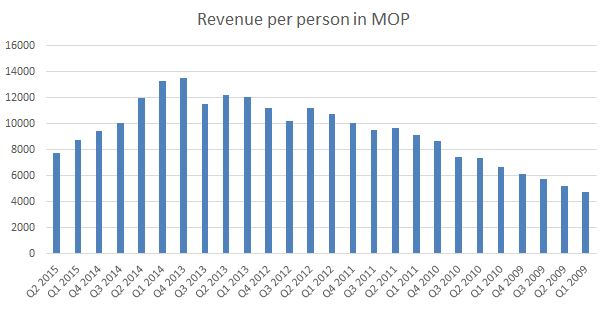
Let’s have a look at the gambling revenue broken down into visitors (per-head-analysis):
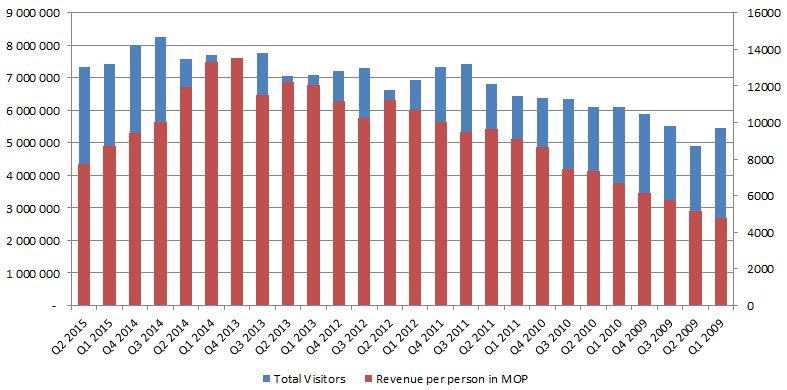
Since Q2 2014, revenue per head (i.e. per visitor) is down compared to the previous quarters. No remember that Q3 and Q4 of 2014 had been extremely strong visitor months hereas revenue as sinking, so let’s have a look at an overlap of the figures:
What can be seen above is a very dangerous trend: Not only are the overall visitor figures decreasing, but at the same time, the spending per head is decreasing as well. The current spending rate of about 7740 MOP per visitor in gambling revenues is the lowest figure since Q3 2010.
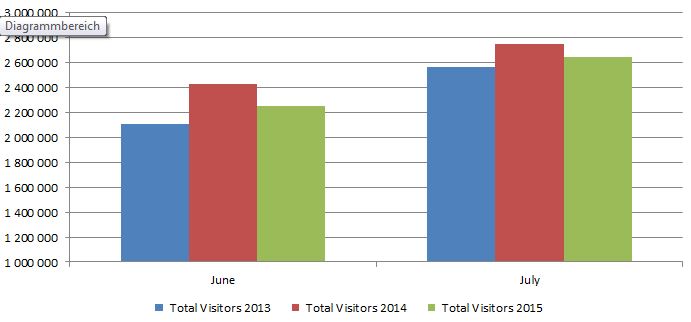
This leads us to our next verification: which major casinos or hotels opened during the recession? Often it is talked about that Macau is adding it’s Cotai 2.0 projects to the market. Galaxy Macau Phase 2 was the first of several large resorts to open. It opened on May 27th 2015. So let’s have a closer look at the months that followed the opening. In particular we are looking at visitor figures to see if an additional casino would attract more visitors:
It is important to note that we want to compare Total Visitor figures on a monthly basis agains the same period the year before and the year before that. We do NOT want to compare consecutive months as that might be a one-time trend, whereas comparing a similar time in the year the year before will give one a clue if there had been an impact or not.
As can be seen above, June 2014 and July 2014 had seen much higher visitor figures than 2015 or 2013. That is in line with previous indications about a peak in 2014. As such whatever stimulus the opening of Galaxy Macau Phase 2 had, it was not enough to get visitor figures back up to 2014 levels. They are however higher than 2013.
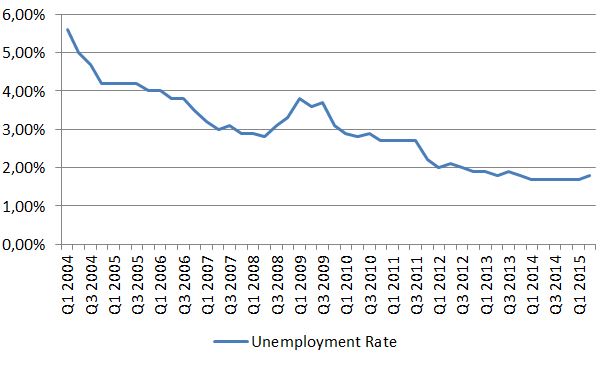
Above we have looked at revenue figures and total visitors. We have not yet looked at individual casino’s performances (which would require a little bit of deep research for which I do not have time at hand right now). We can however have a look at the unemployment rates of Macau:
Over the years unemployment dropped significantly and even throughout most of the recession, unemployment was at a record low of 1.7%. Only in the second quarter of 2015 unemployment slightly increased to 1,8%. As such it can be concluded that the recession had no impacts on the employment situation of the Macau workforce.
What are the external factors that caused the above?
- China’s anti-corruption campaign
- Macau’s smoking ban
- Change of visa policy for mainland Chinese tourists coming to Macau (this has been reversed in the meantime)
- Occupy Central demonstrations in Hongkong (which led to tour group cancellations)
- Macau’s sole dependency upon mainland visitors for gambling revenue
- China Central Bank’s recent decision to devaluate the RMB against the US dollar (and thereby against MOP and HKD)

You must be logged in to post a comment.